
GUIDE
How to change chart colors in TradingView
Where every chart color lives in TradingView, how to paste in hex codes, and how to save it all as a template you can switch to in one click.
TradingView's default chart is teal and red candles on a white or black background. It works, but you'll stare at it for hours, so it's worth making it yours. This guide shows where every chart color lives in TradingView, how to paste in hex codes, and how to save the result as a template so you can switch to it in one click.
You can follow along with your own colors, or pick a free theme from Wicked Charts and copy its hex codes as you go.
1. Open Chart settings
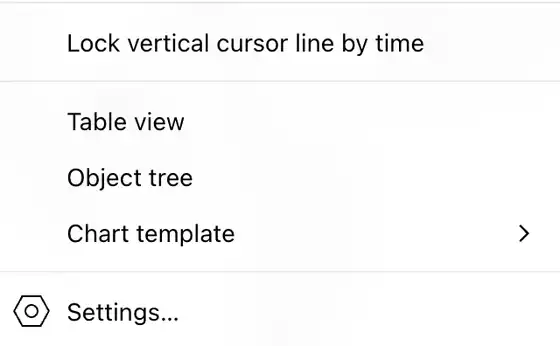
Right-click anywhere on the chart and choose Settings…, or click the gear icon at the top right of the chart. You can also double-click a candle. The settings window opens on the Symbol tab.
2. Change the candle colors
On the Symbol tab, the candle section has three rows: Body, Borders and Wick. Each row has two color boxes, the first for up candles and the second for down candles.
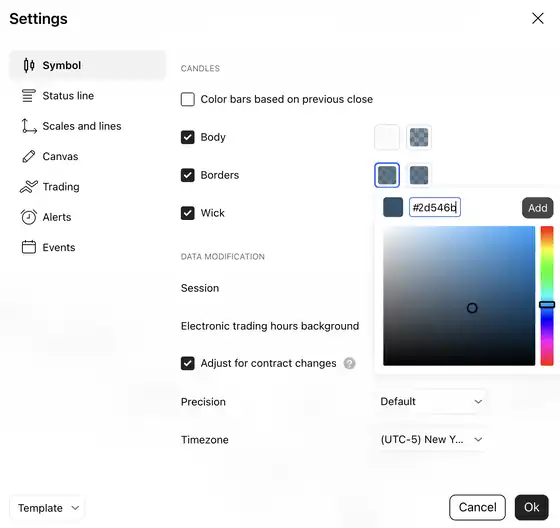
- Click the up color box next to Body. A palette opens.
- Click the + (Add custom color) under the palette.
- Type or paste the hex code (for example #5F86A6) into the hex field and click Add.
- If the theme lists an opacity below 100%, set it with the Opacity slider at the bottom of the palette.
- Repeat for the down color, then do the same for Borders and Wick.
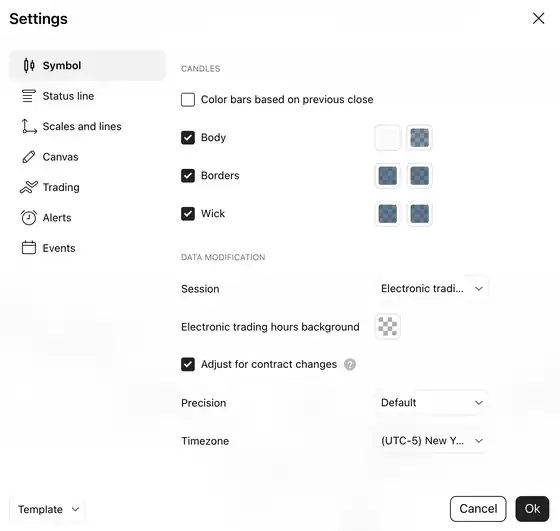
If you'd rather have plain candles with no outline, untick Borders. Many themes look cleaner that way. On Wicked Charts, every theme has a Borders switch under the chart, and the copied colors follow it. Tip: keep “Color bars based on previous close” unticked, or your candle colors won't follow open and close.
3. Change the background and grid
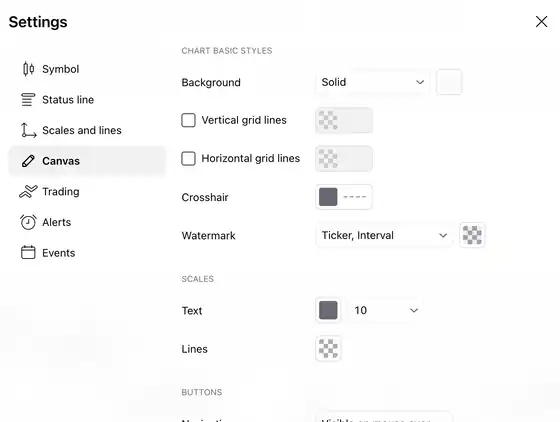
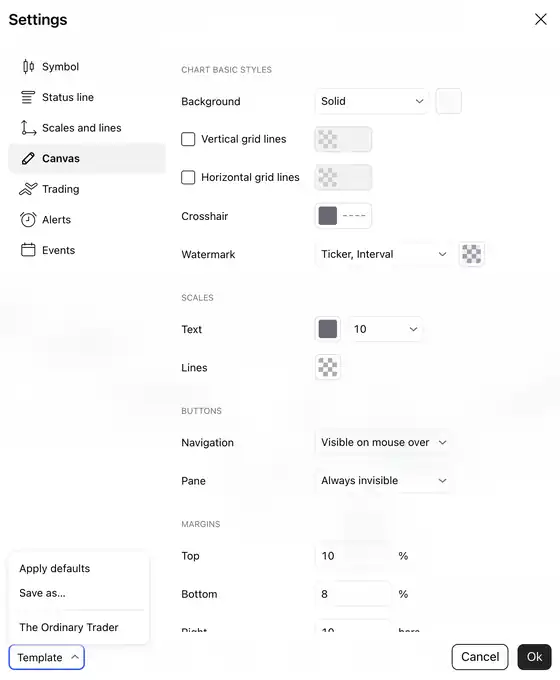
Open the Canvas tab.
- Next to Background, choose Solid and set the color. (If it's set to Gradient, switch it to Solid: a solid color matches the themes here exactly.)
- Tick Vertical grid lines and Horizontal grid lines (or untick either to hide it) and set each one's color.
- While you're here, check the Text color under Scales so the price and time labels stay readable on your new background.
4. Add FVG and indicator colors
TradingView doesn't draw fair value gaps on its own: there's no built-in FVG setting. You need an indicator, and its colors live in that indicator's settings.
We use FVGs [Ordinary Trader], built by The Ordinary Trader for ICT traders. It finds FVGs on up to ten timeframes, from 1 minute to monthly, shows higher-timeframe gaps in side columns beside price, and turns broken FVGs into inversed FVGs automatically. To set its colors:
- Add the indicator to your chart from its TradingView page.
- Hover its name at the top left of the chart and click the gear icon.
- On the Inputs tab, scroll to Colours and set Bullish FVG and Bearish FVG, each with its Border. Use the opacity slider for each one: FVG boxes work best see-through, usually between 12% and 35%.
Using a different FVG indicator? The colors will be in its Inputs or Style tab instead.
The same goes for EMAs and market structure indicators. Wicked Charts lists these “Detail” colors with every theme, picked so thin lines still show on the background.

5. Save it as a chart template
This is the step most people skip, and it's what makes a theme worth setting up.
- With your colors set, click Template at the bottom left of Chart settings.
- Choose Save as…, name it (for example “Opening Bell”) and click Save.
- Click Ok to close settings.
Next time, right-click the chart, hover Chart template and pick your theme by name (or use the Template menu in Chart settings). Every color changes at once. You can save as many as you like, say a light one for the day and a dark one for the evening. Apply defaults in the same menu takes you back to TradingView's own colors.
Indicator colors are saved with the indicator, not the chart template. To keep them, save the indicator's settings as its own default (the Defaults button in its settings) or save your whole layout.
Change colors on the TradingView app
On iOS and Android, tap the chart, then the gear icon, and you'll find the same Symbol and Canvas settings. Templates you save on desktop are available on your phone once you're signed in.
Light or dark mode
TradingView's light or dark mode changes the whole app, not just the chart. Turning on dark mode may reset your chart colors to TradingView's dark defaults, so save your theme as a template first. More in our article on TradingView dark mode.
Where to find colors worth using
Every theme on Wicked Charts lists its colors in the order of the steps above: canvas first, then candles, then FVGs and Detail. Hit Copy colors and you get the whole list with opacities, ready to paste one by one. Start with the Editors' picks, or browse by mood and color in all color themes.
Common questions
Why don't my candle colors change? Check that you changed the up and down boxes on the Body row, and that “Color bars based on previous close” is off.
Can I make TradingView remember my colors for new charts? Yes. Save them as a template, then apply that template to any new chart. Your last used colors also carry over to new charts in the same layout.
Can I share my colors? The simplest way is to share the hex codes. Wicked Charts gives every theme a link, and the theme generator gives a link to your own design.
Make your charts wicked.
Browse all themes